CRT
CRT, Done-For-You: Auto-Map HTF Candle Ranges, Bias Shifts & Execution Zones
Got you — same structure, same tone, but cleanly adapted to CRT 👇
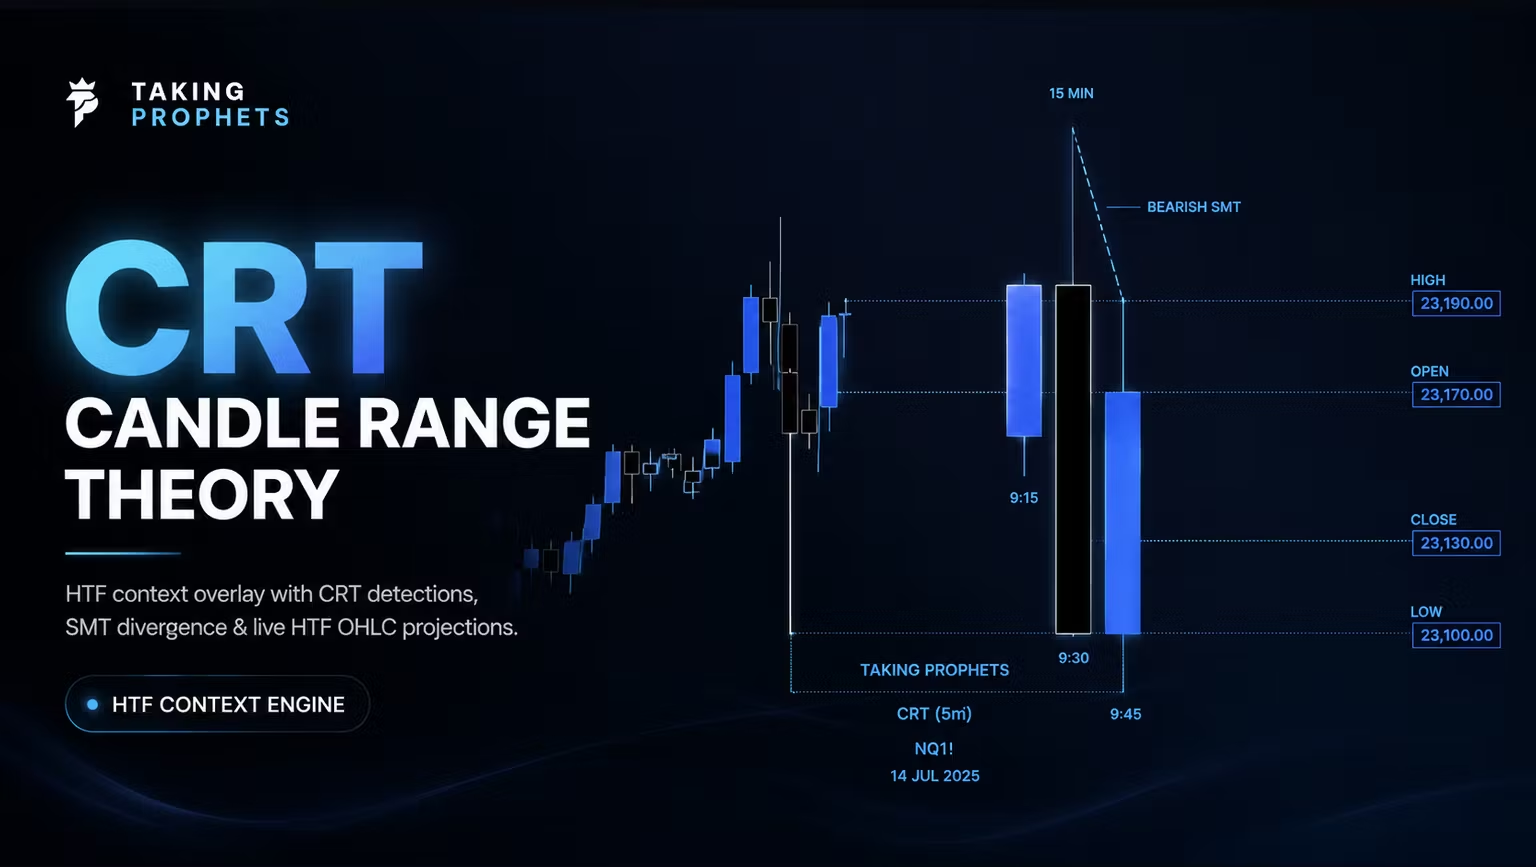
CRT (Candle Range Theory) is a higher-timeframe context tool that automatically maps candle ranges, phase shifts, and directional bias—so you don’t have to manually project them.
What it watches:
Higher-timeframe candle ranges
Range transitions & phase shifts
HTF directional bias across sessions
What you see:
Auto-projected HTF candle ranges
Clearly defined range highs, lows, and equilibrium
Visual phase shifts as price transitions between ranges
A structured framework to align LTF execution inside HTF context
Why it helps:
Candle Range Theory is powerful—but easy to mis-mark or misinterpret.
CRT removes discretion from HTF range projection and bias mapping.
Keeps you trading with structure, not guessing direction.
Saves time and keeps your execution aligned with higher-timeframe intent.
Important:
CRT is not a signal or a promise of results.
It is a context, visualization, and framework tool designed to support Candle Range Theory analysis.
Use for education and as part of your own trading process.
Not financial advice.
- 8 days ago
Amazing all indicatiors gave beautiful insight on market update quickly and work really well backtesting is amazing and I can see it going to very far lengths.
- 9 days ago
Absolutely amazing team behind all indicators and other products. Also a very tight knit community always helping eachother out. There are truly no other platform in the trading space as these guys
- 9 days ago
Great community with combined ideas and indicators that make trading easier. Live streams are educational and always fun to listen to. They are quick to help you out and are respectful.
- 9 days ago
Goated indicators and community, really simplified trading and has made it less of a stress to mark up my chart. Overall the best in the business.